Group Cart
Empowering Local Grocery Stores
Designing intelligent tools that help small retailers make data-driven decisions and build sustainable operations.
Preliminary investigation
Small grocers face persistent inventory challenges driven by supplier delays, volatile demand, and weather-related disruptions that make restocking unpredictable. Independent retailers still rely heavily on manual counts and fragmented data, leading to ordering mistakes, data errors, and recurring stockouts.
_edited.png)
New York
Texas
California


Regional patterns show additional pressures—such as spoilage and excess perishables in California, demand-spike shortages in New York, and fragmented manual operations in Texas. Compared with non-food staples, fresh goods carry shorter shelf lives and stricter storage needs, making them far more vulnerable to inaccurate forecasting.
Together, these constraints highlight why small grocers urgently need lightweight, data-driven tools to stabilize inventory and reduce losses.
User Research
User Profiles
Julia is a small business owner who manages all purchasing manually. She struggles to predict reorder timing and loses revenue from sudden stockouts. She needs a simple, automated tool with no learning curve.
Daniel is an operations manager overseeing inventory for multiple stores. He lacks clear visibility across locations and often relies on instinct, leading to waste. He wants a unified inventory view and data-driven forecasting.
Marco is a store associate who handles shelving and customer questions. He frequently faces missing items and wastes time checking the backroom. He needs instant stock information and a mobile tool he can use on the floor.
Market Research


Julia T.
Marco R.
Daniel H.

Industry reports show that ongoing supply chain disruptions—from supplier failures to rising transport costs and weather-related shortages—continue to cause stockouts that manual systems cannot absorb. Even though national stockout rates have fallen from 25% to about 7%, small retailers still face meaningful losses, underscoring the need for an affordable, automated, data-driven inventory tool to stabilize demand and reduce missed revenue.
Concept Development
System Information Architecture
Dashboard
Supplier & Logistics
Orders
Inventory
Sales
Design Principles
Clarity & Readability
Simple hierarchy and white space ensure quick scanning.
Scalability
Modular system supports future analytics expansion.
Actionability
Real-time insights help store owners act immediately.
Core Dashboard Modules
Supplier & Logistics
Measure delivery reliability, track suppliers, and optimize restocking schedules.
Inventory
Monitor stock levels & low-stock alerts
Auto-generate reorder suggestions
Visualize turnover rates
Order
Analyze daily & monthly revenue
Identify best-selling products
Compare trends over time
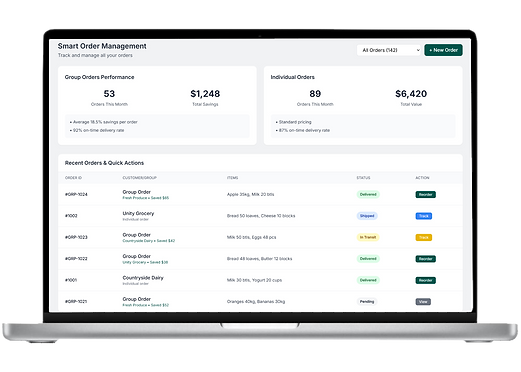
Sales
Manage group & individual orders
Track real-time savings & volume
Sync automatically with supplier records
Core Dashboard Modules

Store A

Store B

Store C

Order
Order
Order
Collaborative purchasing aggregates demand across independent stores, converting fragmented individual orders into a unified buying force.
Order Pooling
(Aggregating demand via GroupCart)

Shared Cart

Bulk Discount
(Up to 25% Savings)
Individual Orders
(Small Quantity = High Price).
User Feedback & Testing
We conducted usability testing with small business operators responsible for daily inventory checks and order planning. Participants interacted with a mid-fidelity prototype while completing routine restocking tasks under simulated time pressure.
Key User Feedback
“I’m not sure which numbers I should look at first.”
Users struggled to identify which metrics were critical for immediate decisions when all data points appeared visually similar.
“Inventory and orders feel mixed together.”
Participants had difficulty mentally separating stock status from ordering actions, leading to hesitation and rechecking.
“I want to know what’s urgent at a glance.”
Users expressed a strong preference for quick visual cues that signal priority without requiring careful reading.
Design Responses
Clear separation between inventory and orders was introduced to align with users’ mental models.
Color-coded modules and strengthened visual hierarchy were applied to surface urgency and guide attention.
Interactive elements were refined to provide immediate feedback and reinforce user confidence.
Layout
colors
Interactive
Validation & Impact
After iteration, users completed tasks with less hesitation and fewer errors. Scanning key information became faster and more intuitive.
Overall usability score improved from 68% to 92%,confirming that the refinements effectively supported real-world decision making.